Bitcoin Price Analysis: Why BTC Slipped Below $69,000 Amid Macro Volatility and Geopolitical Tensions
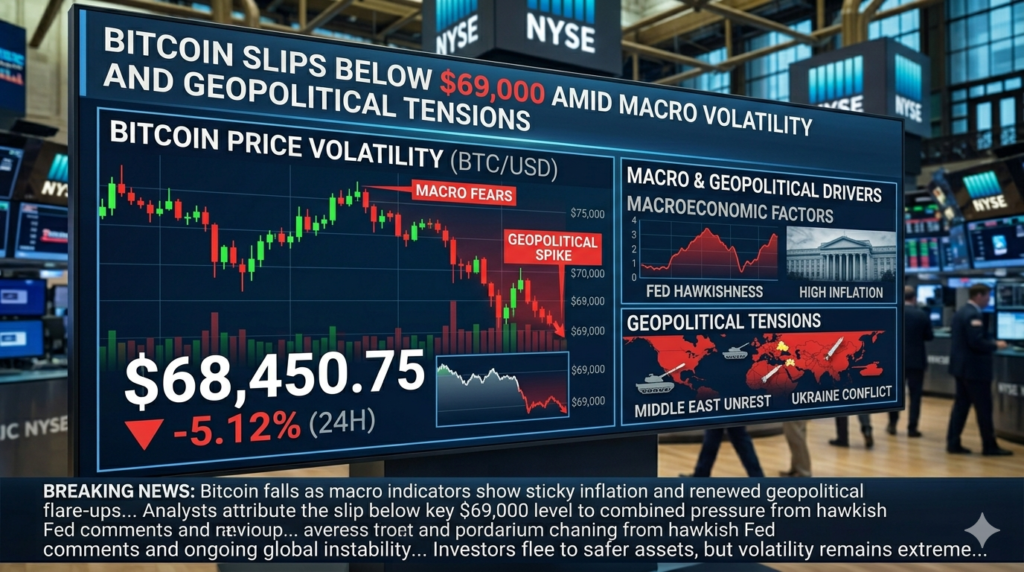
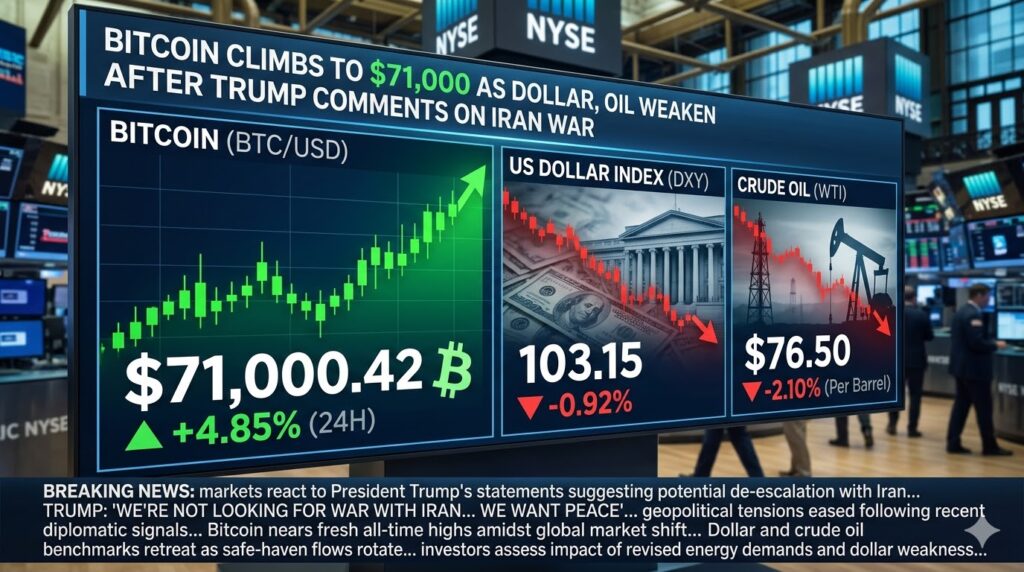
The cryptocurrency market is currently navigating a period of significant turbulence as Bitcoin (BTC) recently slipped below the $69,000 mark, leaving investors and analysts closely watching macro headlines for the next directional cue. On March 26, 2026, the leading digital asset saw a decline of more than 3% from its overnight high of $71,000, highlighting the ongoing sensitivity of risk assets to global economic and geopolitical developments. This price action occurs against a backdrop of rising oil prices, surging bond yields, and a broader retreat in the technology sector, suggesting that the “crypto winter” or “summer” narratives are increasingly being replaced by a complex “macro-driven” reality.
The Geopolitical Catalyst: Oil as the Market Barometer
One of the primary drivers behind the recent downward pressure on Bitcoin is the shifting sentiment regarding the Middle East. Initial optimism surrounding potential peace between Iran and the U.S. began to fade, leading to a resurgence in risk-off sentiment. As hopes for de-escalation cooled, crude oil futures rose approximately 4%, effectively reversing earlier declines.
In the current market environment, oil has become a primary barometer for broader financial health. Higher energy prices often reinforce concerns regarding persistent inflation and potential supply disruptions. For Bitcoin—which is frequently traded as a high-beta risk asset—rising oil prices and the resulting inflationary fears create a challenging environment for sustained upward momentum. Joel Kruger, a market strategist at LMAX Group, noted that the near-term trajectory for Bitcoin will likely remain tethered to these macro developments, stating that while de-escalation could push risk assets higher, continued uncertainty may keep them in a “choppy range”.
A Broader Retreat: Altcoins and the Nasdaq Correlation
Bitcoin was not alone in its Thursday decline. The broader crypto market felt the sting of the pullback, with major altcoins experiencing even steeper losses. Ethereum (ETH), XRP, Solana (SOL), and Cardano (ADA) all plunged between 4% and 5% during the same period. This synchronized drop suggests a systemic withdrawal from riskier positions across the digital asset spectrum.
This trend mirrored performance in traditional equities, particularly in the tech-heavy Nasdaq, which saw a 1.4% decline just after noon on the East Coast. Perhaps most striking is the current state of the “Magnificent Seven” stocks. According to recent data, all seven of these tech giants are now trading at double-digit percentages below their all-time highs:
- Microsoft (MSFT): Down 34%
- Meta (META): Down 30%
- Tesla (TSLA): Down 25%
- Amazon (AMZN): Down 20%
- Alphabet (GOOG): Down 19%
- NVIDIA (NVDA): Down 18%
- Apple (AAPL): Down 14%
The fact that Bitcoin is struggling alongside these tech titans underscores the high degree of correlation between crypto and the traditional technology sector. Furthermore, U.S. 10-year Treasury yields rose to 4.40%, while the 10-year German Bund climbed to 3.06%, providing investors with higher-yielding, lower-risk alternatives to volatile assets like BTC.
The Evolution of Crypto Equities and the AI Pivot
The impact of the market dip extended deeply into crypto-related stocks. Industry leaders such as Coinbase (COIN), Circle (CRCL), and MicroStrategy (MSTR) all posted losses between 3% and 4%. However, the most dramatic losses were seen in the bitcoin mining sector.
A significant shift is occurring within the mining industry. Many traditional miners have either transitioned or are currently transitioning into AI infrastructure plays. Because these companies are now viewed as tech infrastructure providers, their stock prices are increasingly tied to general tech sentiment rather than just the price of Bitcoin. On Thursday, several prominent names saw sharp declines:
- Hut 8 (HUT): Dropped 8.6%
- IREN (IREN): Fell over 7%
- Riot Platforms (RIOT): Fell over 7%
- TeraWulf (WULF) and HIVE Digital (HIVE): Both posted steep declines.
Adding to the sector’s woes, WhiteFiber (WYFI) saw its shares plummet 14% following fourth-quarter results that revealed a widening net loss of $1.5 million and a total full-year loss of $24.7 million. Its parent company, Bit Digital (BTBT), also saw its shares decline by about 8%.
Defying the Trend: MARA Holdings and Debt Management
Despite the general market gloom, MARA Holdings (MARA) emerged as a notable outlier. MARA shares rose by 8.7% to 10% after the company reported a strategic sale of $1.1 billion in bitcoin. This massive liquidation was not a sign of lack of faith in the asset, but rather a calculated move to pay down debt and fund a debt buyback. This move was well-received by investors, who prioritized the company’s balance sheet health over the reduction in its BTC holdings.
Other unique strategies are also emerging in the corporate world. For example, GameStop recently made headlines by turning its $368 million bitcoin stash into an options income play, demonstrating the increasingly sophisticated ways corporations are managing digital asset treasuries.
The “Trump Effect” and Political Influence
Politics continues to play a pivotal role in the daily fluctuations of the crypto market. On the same day BTC slipped below $69,000, prices saw a modest recovery after U.S. President Donald Trump announced a 10-day extension on the pause of U.S. attacks against Iran’s energy infrastructure. This move provided a brief respite for the market, as it temporarily eased fears of an immediate escalation in the energy war that has been driving oil prices and bond yields higher.
Furthermore, the political landscape for crypto remains active with the White House crypto czar, David Sacks, transferring to a presidential advisory committee role, and the “Stand With Crypto” initiative preparing strategies for the U.S. midterms. These developments indicate that while macro factors dominate the short-term price action, the long-term regulatory and political framework for digital assets is still being vigorously contested and shaped in Washington.
The Institutionalization Phase: Stablecoins and Mortgages
While price volatility captures the headlines, the underlying infrastructure of the crypto ecosystem continues to mature. We are currently witnessing what analysts call the “institutionalization era” of stablecoins. In North America, which leads in regulatory frameworks, regulated issuers like USDC, RLUSD, and PYUSD are gaining significant market share. Notably, RLUSD surpassed $1 billion in market cap within its first year, signaling a strong institutional appetite for transparent and compliant stablecoin options.
In another major step toward mainstream adoption, Coinbase and Fannie Mae have begun bringing crypto-backed mortgages to homebuyers. This development suggests that despite the “choppy range” of Bitcoin’s price, the utility of the underlying technology and the integration of digital assets into core financial infrastructure are proceeding at a steady pace.
Conclusion: What’s Next for Bitcoin?
As of late March 2026, Bitcoin remains in a complex position. It has been trading in a tight range for nearly 50 days, a pattern that some analysts argue is not a “bear flag” but rather a period of consolidation. The market’s immediate future hinges on macro developments, particularly regarding Middle East stability and its impact on oil prices.
Key Takeaways for Investors:
- Watch the Oil Barometer: If crude oil prices continue to rise due to geopolitical tension, expect further pressure on BTC.
- Monitor Tech Correlations: With the “Magnificent Seven” struggling, Bitcoin’s path upward may be blocked until the broader tech sector finds its footing.
- Mining vs. AI: Investors in mining stocks should be aware that these companies are now as much an AI play as they are a crypto play.
- Regulatory Resilience: Despite price dips, institutional adoption via stablecoins and mortgages indicates a strengthening foundation for the industry.
While the slip below $69,000 is a setback, the modest recovery following President Trump’s strike pause extension suggests that the market is ready to react positively to any signs of de-escalation. For now, Bitcoin remains at the mercy of the headlines, requiring investors to stay informed on both the charts and the global political stage.